If you have a influxdb server running , there is some data collector like Collectd that can be used to automatically write data in your database.
But collectd is very difficult to personalise. and the documentation is pretty bad, (try using the curl plugin and greping data)
You can’t easily add the result of a piped bash command to the collected data for example.
in my case i’ve decided to ignore these pre made solutions that never completely satisfy my needs or write exactly the value i want in the database,
there is a simple way to use a http request to write in the influxDB database.
first before you even write something in ingluxDB, you have to create a database (you only have to launch this command once)
curl -G http://localhost:8086/query --data-urlencode "q=CREATE DATABASE metrics"
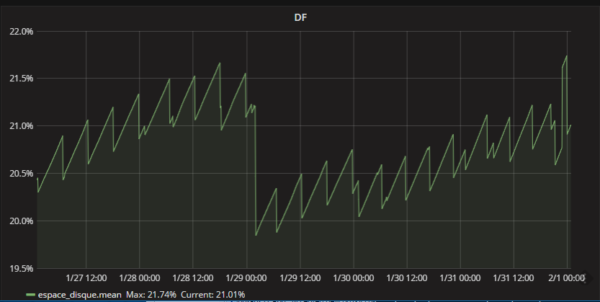
then lets say i want to log every 5min the disk usage in percent of my primary storage device. which is named /dev/mmcblk0p1
the df command is only giving me a rounded value : for example 22%
for my example i want a much more precise percentage , this little script does exactly that.
#!/bin/bash
#change mmc by the name of your drive , ex: sdba
df_total=$(df |grep mmc |awk -F' ' '{print $2}')
df_used=$(df |grep mmc |awk -F' ' '{print $3}')
df=$(echo "$df_used * 100 / $df_total" | bc -l | head -c 6)
curl -i -XPOST 'http://localhost:8086/write?db=metrics' --data-binary "disc_space,df=used value=$df"
this is writing in the database metrics the percentage used with 3 decimals if you are using 10% or more and 4 decimals if you use 10% or less
the changing precision is not a concern in my use case.
then if you want a value every 5min for example do a crontab -e and add the line :
*/5 * * * * bash /root/myscript.sh
you can then use grafana for example to graph the data.
